December 17, 2017
Getting started in Drawbot, part 3: making a perfect, expandable grid
Goedemorgen! This is the third post in a small series about using Python in Drawbot, for Parametric design. If you haven’t read the other posts yet, check out part 1 and part 2.
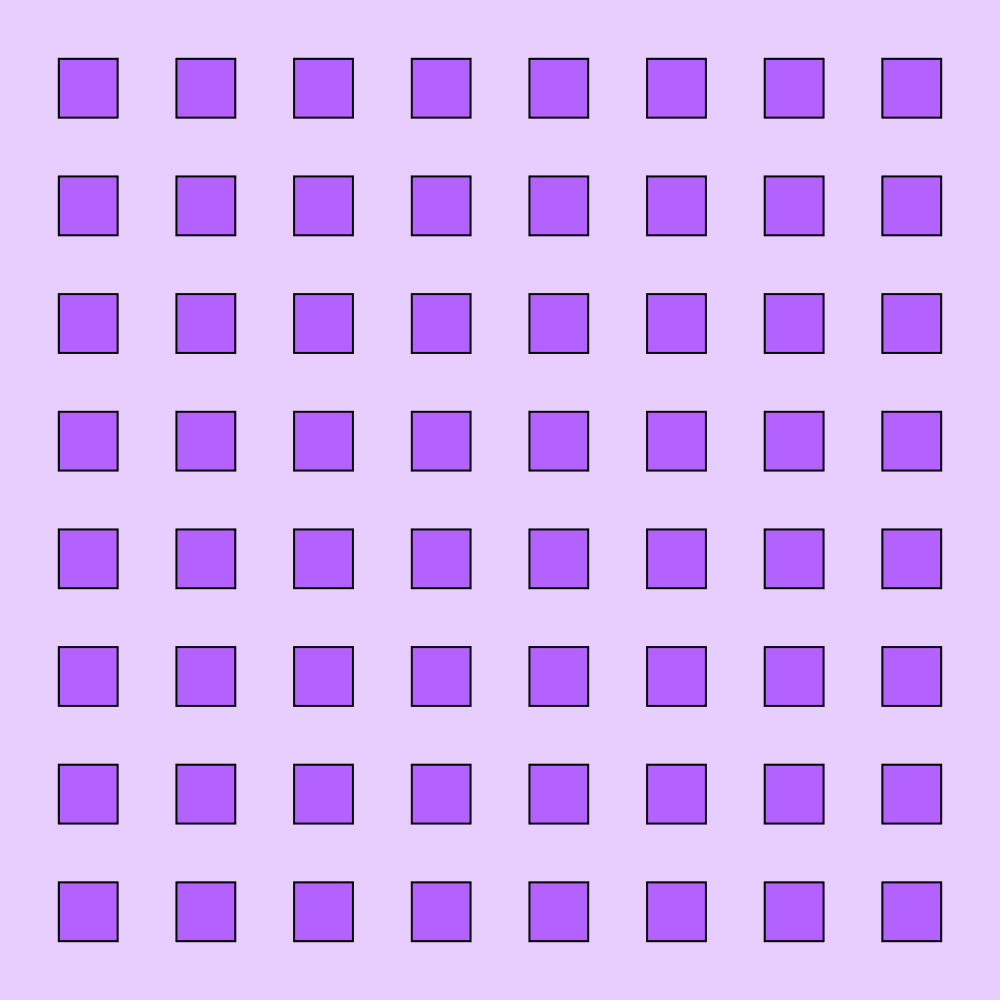
In this post, I’ll be doing a deep-dive into the thought process and logic that goes into making a “perfect” grid, which I’m defining as a grid of rectangles of any number that is sized and positioned to fit every item into the canvas, with equal sizing of margins and items. That will look something like this (and yes, this image was generated from DrawBot):
Let’s make a grid
Goal: We want to make a grid in Drawbot that will create a perfect grid from a given number of rows/columns.
Why? If we can make a grid that is always perfect, no matter how many rows/columns we ask for, we can increase the number of rows and columns in an animation, to make a cool visual effect.
Start simple
To set things up, let’s make a super-simple grid: one “dot” in the middle of the canvas, with equal portions of margin on all sides. Essentially, we will be dividing the canvas into nine equal parts, and we will make a square to fill up the exact center portion.
I’m calling it a “dot” even though it will be a square shape, because the variable “square” confuses me when it’s all over my code – it sounds too much like a math function.
Here’s the super-simple grid:
w = 1000
h = 1000
rows = 1
cols = rows # make as many columns as rows, to make a grid

fill(0,1,1)
strokeWidth(2)
stroke(0,0,0)

# this illustrates the basic grid setup *with a single dot*
for currentCol in range(cols):
    # the dot needs to be one third of the canvas size, so we can divide the canvas by number of dots (1) plus 2
    dotSize = w/(cols+2)
    # in this simple grid, we just want to move the dot over by its own width (1/3 of the canvas)
    x = dotSize
    for currentRow in range(rows):
        # in this simple grid, we just want to move the dot up by its own height (1/3 of the canvas)
        y = dotSize
        # we want the dot to have equal-sized spacing on the side and bottom, so we can use the dotSize for the x and y coordinates, in addition to width and height
        rect(x, y, dotSize, dotSize)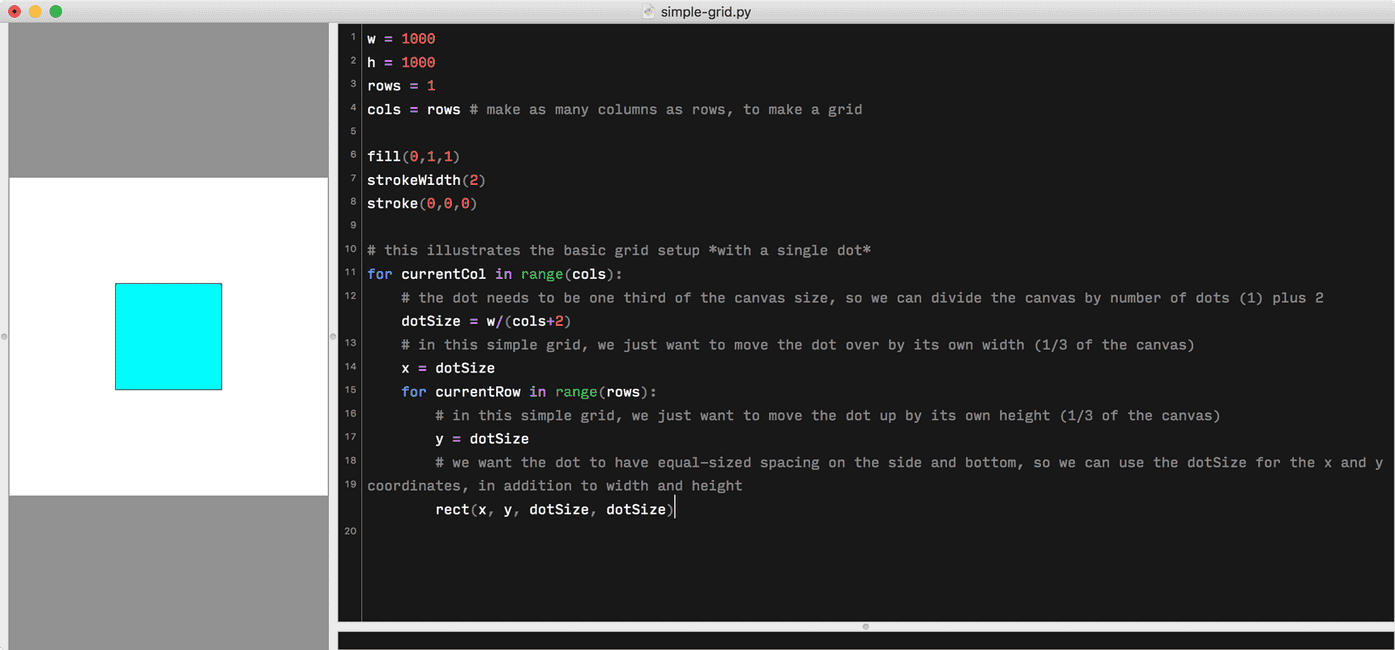
Let’s make it with two “dots”
Now, let’s increase the flexibility of our grid, by adding a second row and column, to make a total of four dots, all with perfectly equal spacing around them.
This won’t quite get us there, but it gets us close:
w = 1000
h = 1000
rows = 2
cols = rows # make as many columns as rows, to make a grid
fill(0,1,1)
strokeWidth(2)
stroke(0,0,0)
# We want to position dots in a grid, so we first need to make a loop to change the x position for each new dot — this will create multiple columns.
for currentCol in range(cols):
dotSize = w/(cols+2)
# we want to move the x position *each time the loop runs*, so we need to multiply the currentCol
x = w/(cols+2) + currentCol*dotSize
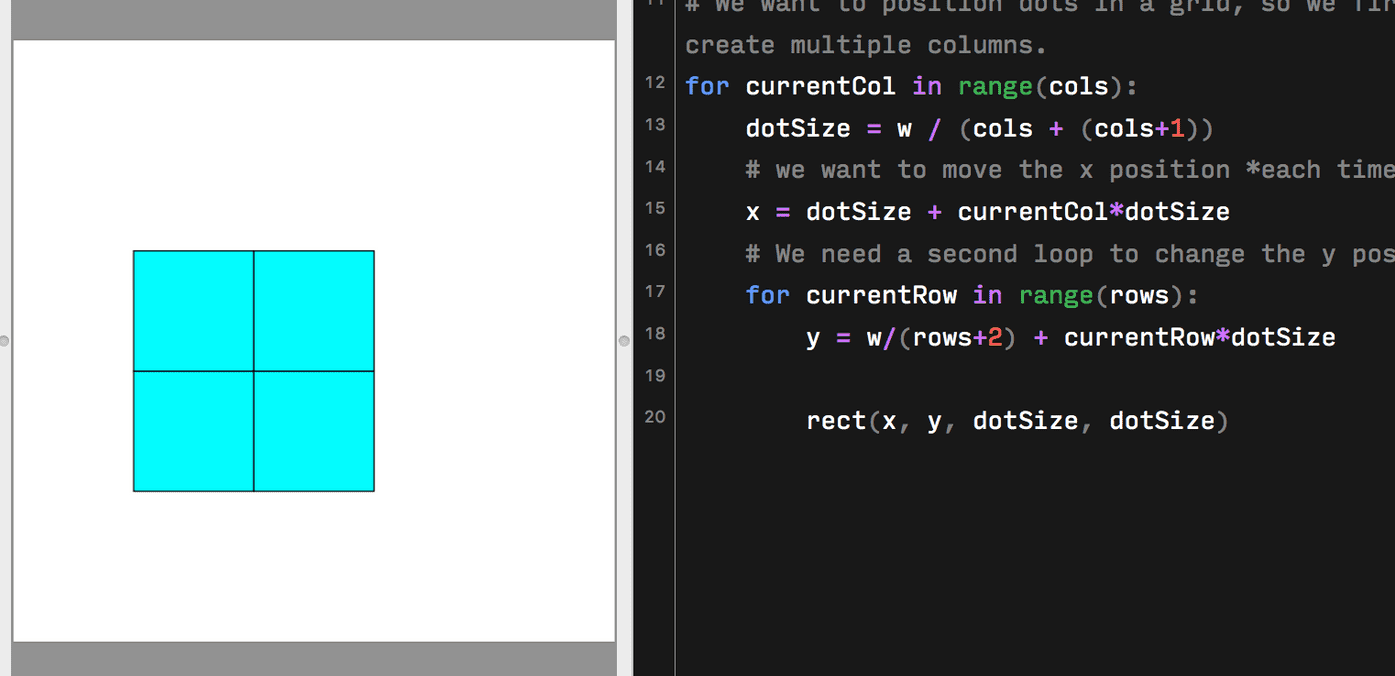
# We need a second loop to change the y position of dots, to make rows.
for currentRow in range(rows):
y = w/(rows+2) + currentRow*dotSize
rect(x, y, dotSize, dotSize) 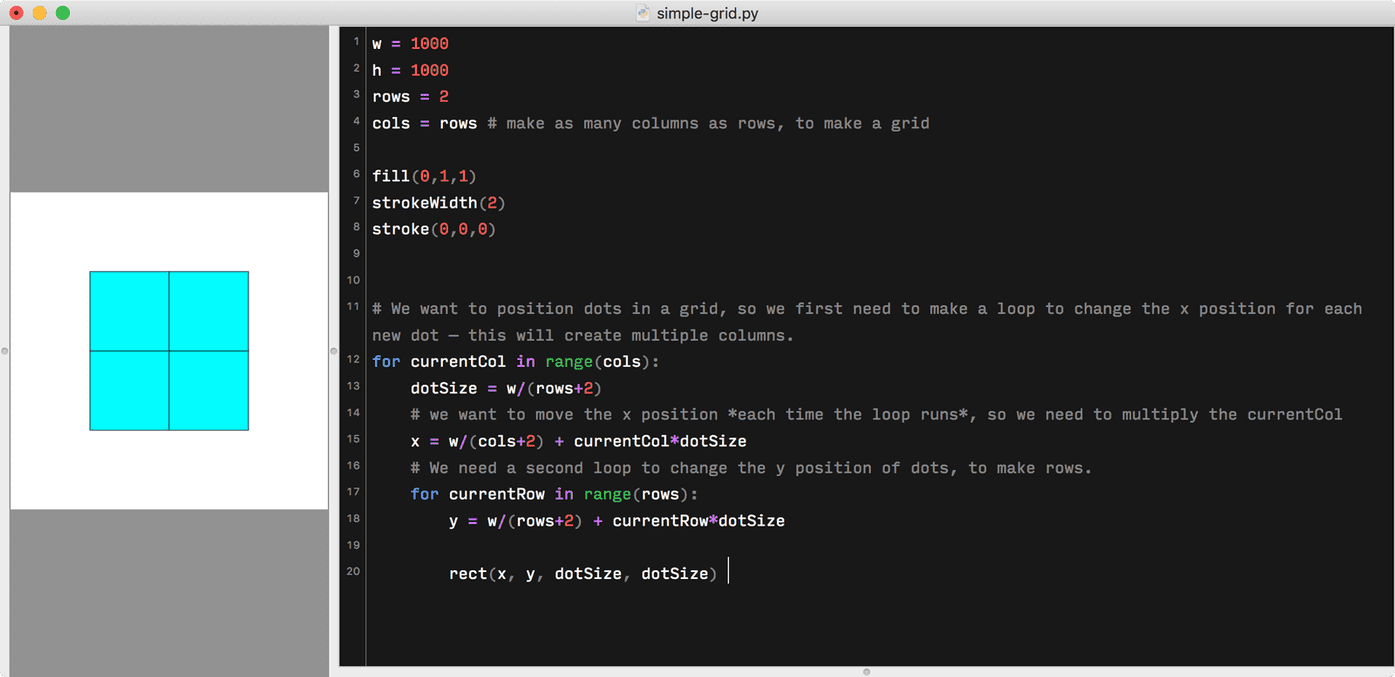
We have four squares, and they have equal space on all sides. It even keeps working to increase the number of rows and columns:

But obviously we’re not done yet, because the dots don’t yet have spacing between themselves. For this, we need to:
- Decrease the size of each dot
- increase the amount we move each dot, in both directions
Decreasing the dot size
Right now we set dotSize equal to w/(rows+2). We’re taking the overall canvas width, and dividing this by the number of rows, plus 2. This gives us the proper size to have dots in the middle, with equal spacing around only the left and right sides (these two sides are the “plus two”). So, what do we need to add to put space in between each additional dot? This is the kind of thing I find helpful to draw out to think through…
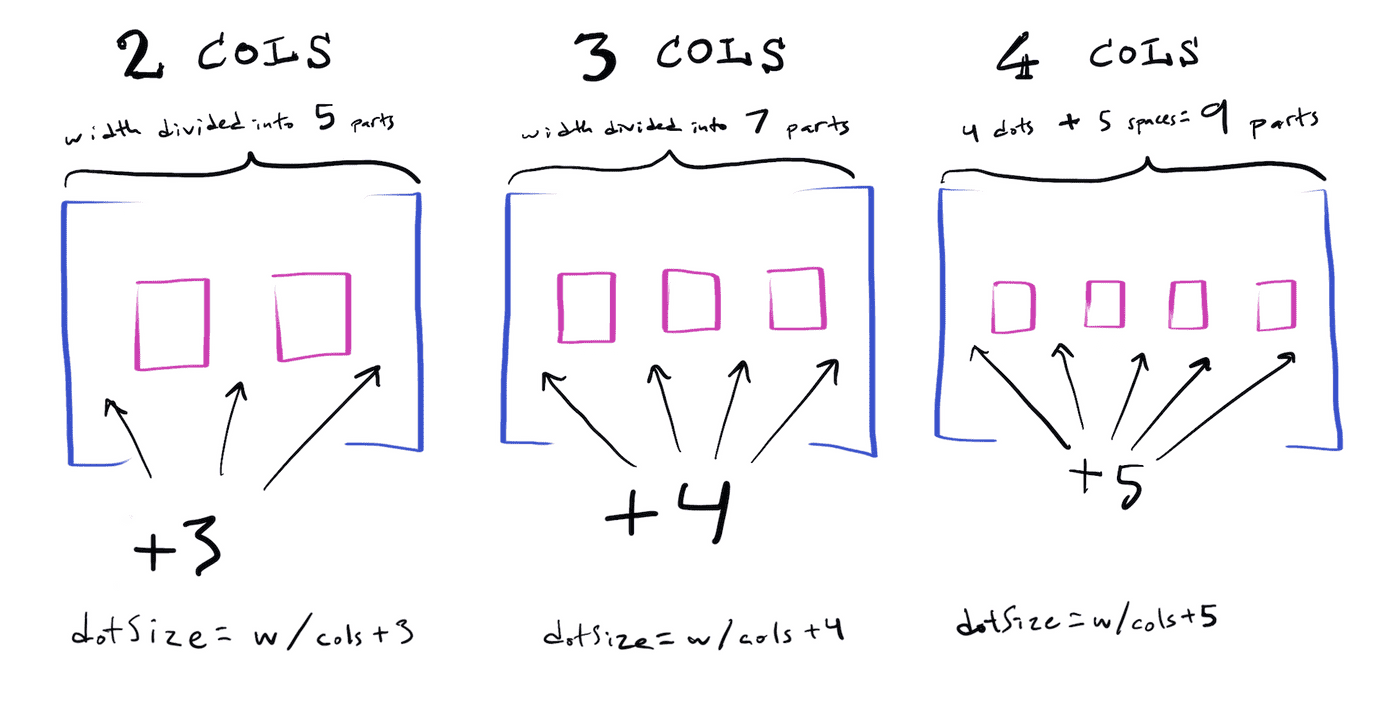
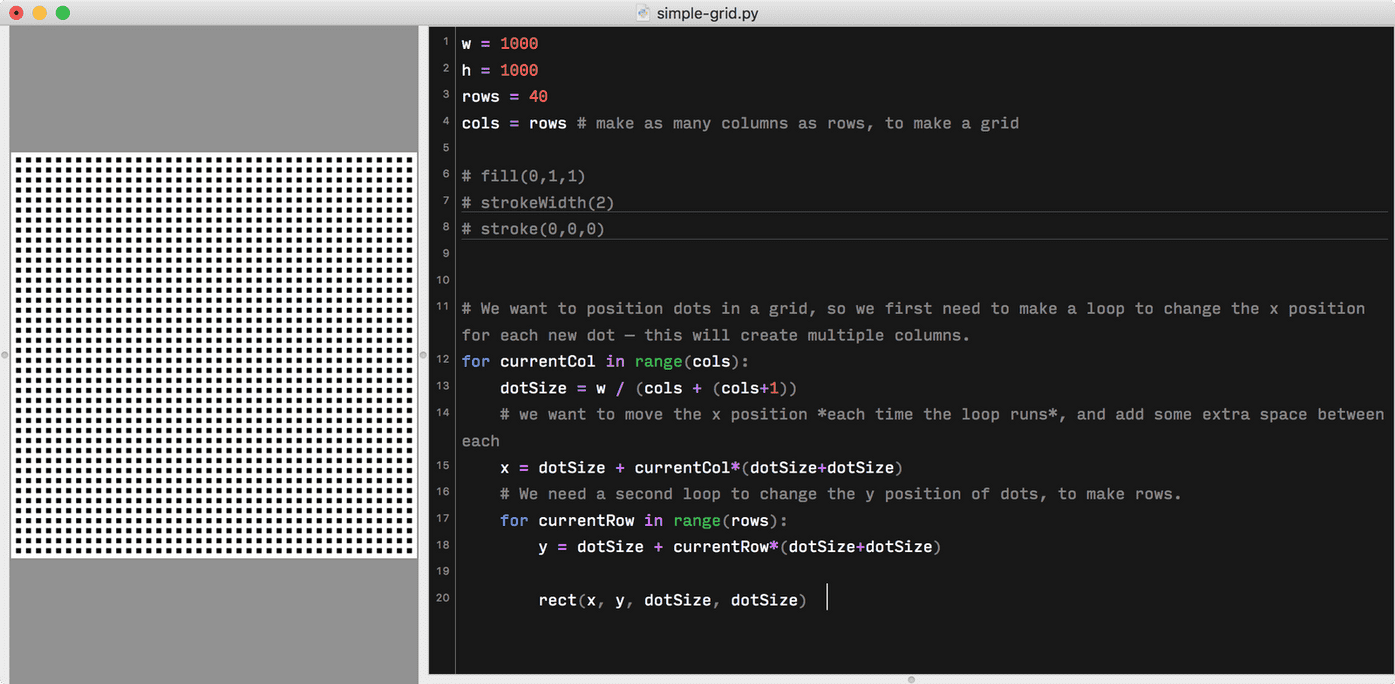
What’s the pattern? We always need to take the columns, and add the columns plus one. Or in code, we can say: dotSize = w / (cols + cols + 1).
Increasing the spacing
Just like we looked for a pattern and made the dots smaller than that, we can do something similar for our spacing, in the x value we use to move each column over. Once we get that working, our columns will look more like our drawing above.
Before I show the answer, try it on your own!
Have you tried it yet? Are you sure you aren’t on the cusp of figuring it out and feeling the endorphin rush of cracking a puzzle?
Keep scrolling for the answer if you want it now. 😸
Okay, either you’ve figured it out or you’re stuck — either is fine. 🙂 Let’s look at how I figured it out.
We were starting with:
x = w/(cols+2) + currentCol*dotSize…which was too big on the very left, and not putting space between dots. We already know we need to change the overall unit width more than we were, so can swap in the same thing we did for dotSize, making it:
x = w/(cols + cols + 1) + currentCol*dotSize…which we can simplify to
x = dotSize + currentCol*dotSize… this looks right for the very left space, but we still need more space between our dots.
We’re already moving each dot in each loop by the dots currentCol times dotSize, meaning that in the first loop, it starts x at dotSize, then adds 0 times dotSize, putting the first dot at “one dot over.” On the next loop, it places it at dotSize, then adds 1 times dotSize. However, this isn’t quite as much as it needs to move.
For x on each loop, we need to start with dotSize, then add the currentCol times (dotSize plus an extra dotSize).
So, if we’re doing two columns, we’re dividing the canvas by five. The first column (which has the number “zero” in our code loop) needs to start at 200, then it places the dot. The second column (which has the number “one” in our code loop) needs to start at 200, then add 200 to account for the first dot, plus an extra 200 for the space, to result in an x position of 600. If we have more columns, the next loop would just multiply that shift-over a bit more, but with smaller dotSize values.
Putting this into code, this looks pretty simple:
x = dotSize + currentCol*(dotSize+dotSize)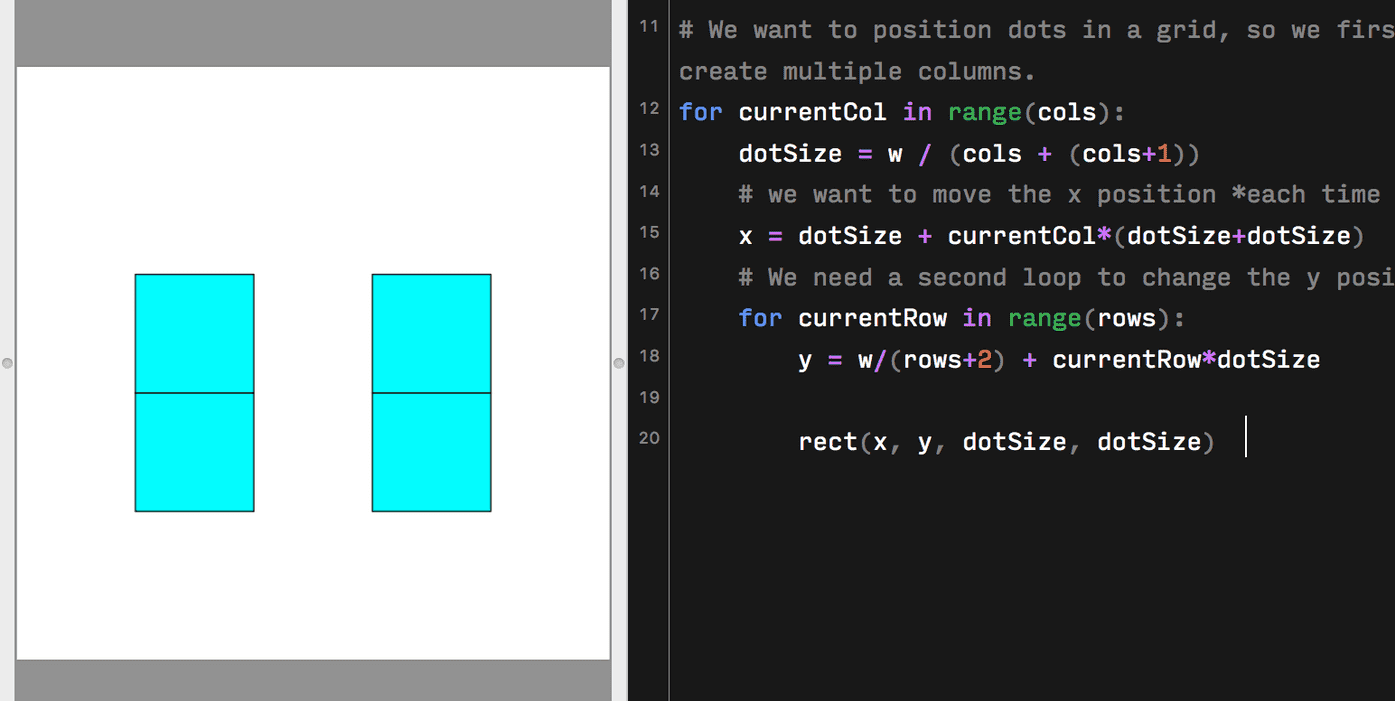
Our columns are working! Now, we just need to update our y value (making sure to swap currentCol with currentRow, because we’re in a secondary loop now:
w = 1000
h = 1000
rows = 2
cols = rows # make as many columns as rows, to make a grid

fill(0,1,1)
strokeWidth(2)
stroke(0,0,0)


# We want to position dots in a grid, so we first need to make a loop to change the x position for each new dot — this will create multiple columns.
for currentCol in range(cols):
    dotSize = w / (cols + (cols+1))
    # we want to move the x position *each time the loop runs*, and add some extra space between each column
    x = dotSize + currentCol*(dotSize+dotSize)
    # We need a second loop to change the y position of dots, to make rows.
    for currentRow in range(rows):
        y = dotSize + currentRow*(dotSize+dotSize)

rect(x, y, dotSize, dotSize) 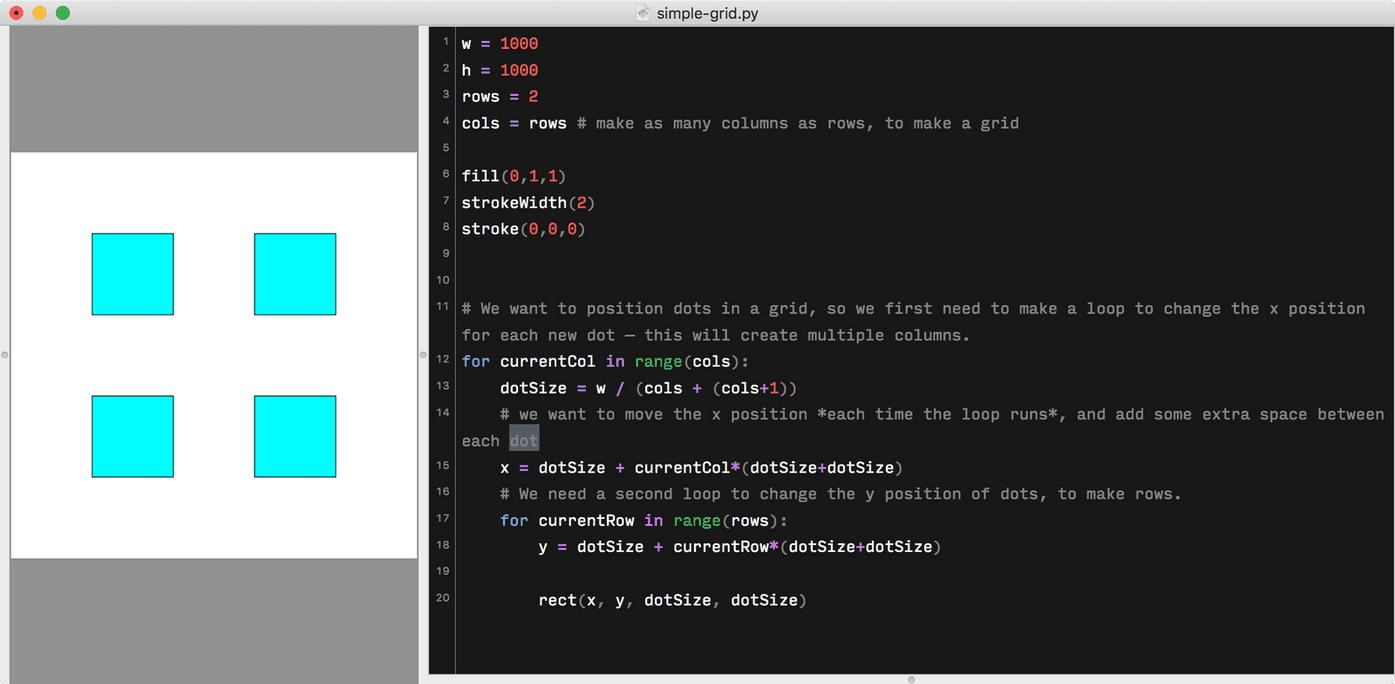
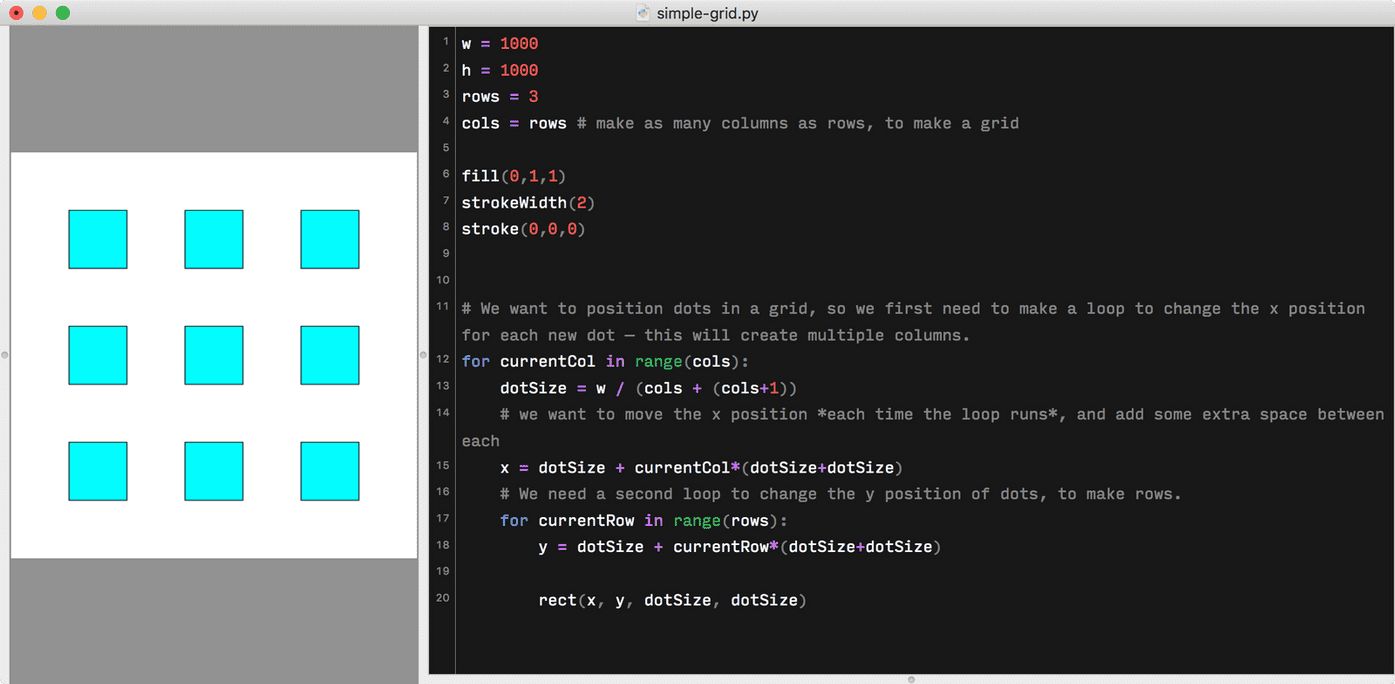
You can increase to however many rows, and it’ll stay perfect. Nice, right?
Nice work! As a reward for your brain’s hard work, take a look at some capybaras enjoying an onsen:
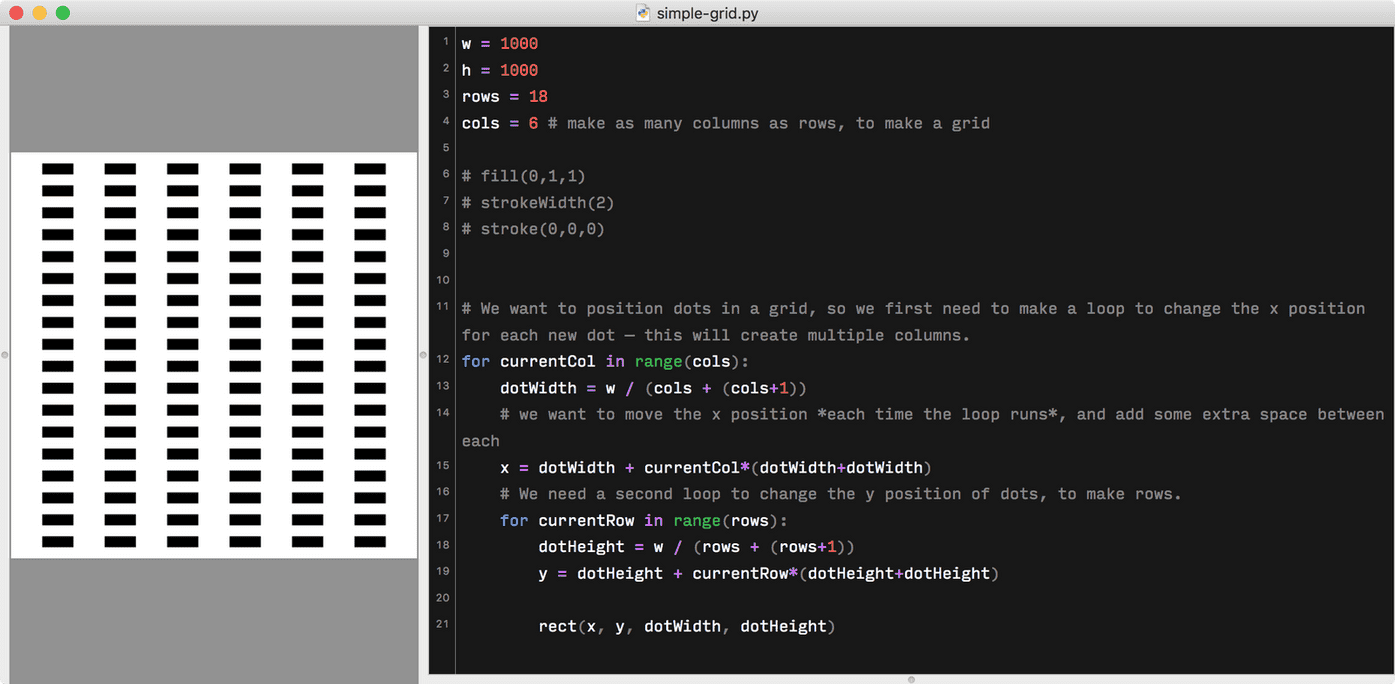
Taking it further
Now that you know the basics, you could convert this to do rows and columns separately:
You could even make an animation which increases the amount of rows in each frame, to create a cool multiplication effect. If you combine it with some color and shape changes in your loops (for instance, using an if statement to make odd currentCol numbers produce an oval, and even currentCol numbers produce a rectangle), you could make something like this:
If you’d like to play with the code from the animation above, you can find it in on my GitHub repo of Drawbot experiments (it’s somewhat messy — sorry — but there’s good stuff in there if you dig).
Happy gridding!
I’m typing these posts into the void, so hopefully someone out there has enjoyed this. Did you actually read this post? Did I make any dumb mistakes? Did this example work for you in DrawBot? Would you like me to continue with more DrawBot posts? Let me know on Twitter!